GeoMarketing is one of the most important and less spoken-of techniques in market research. After 15 years of working with Geographic Information Systems (GIS) and GeoMarketing techniques for market research and analysis purposes for multiple international companies and clients, I’ve come to the conclusion that GIS & GeoMarketing should be at the core of any market research performed by market research or marketing agencies to plan data collection and to ensure quality control over any collected data at any given time.
While most people in the business world might feel distanced from GIS and its applications and think that it’s only related to architecture and urban planning and design, the fact is that almost everyone in the world who uses a smartphone or even watches movies is benefiting from GIS and its application almost every single day.
While playing a game like Pokemon Go, using an app like Google Maps, Uber, Tripadvisor, or Foursquare in the US, or watching an animation or a fantasy movie where there’s a complete city designed and laid out like the movie Cars, we must be aware that GIS is at the heart of all of these creations. As such, and with maps applications alone, I can safely say that GIS is crucial not only for marketing but for everyone’s day-to-day life as well.
In this article, I’m going to give you an overview of what is a Geographic Information System (GIS) and its correlation to market research as well as GIS’s role in market research sampling and how to perform location-based data validation and analysis.
What are Geographic Information Systems (GIS)?
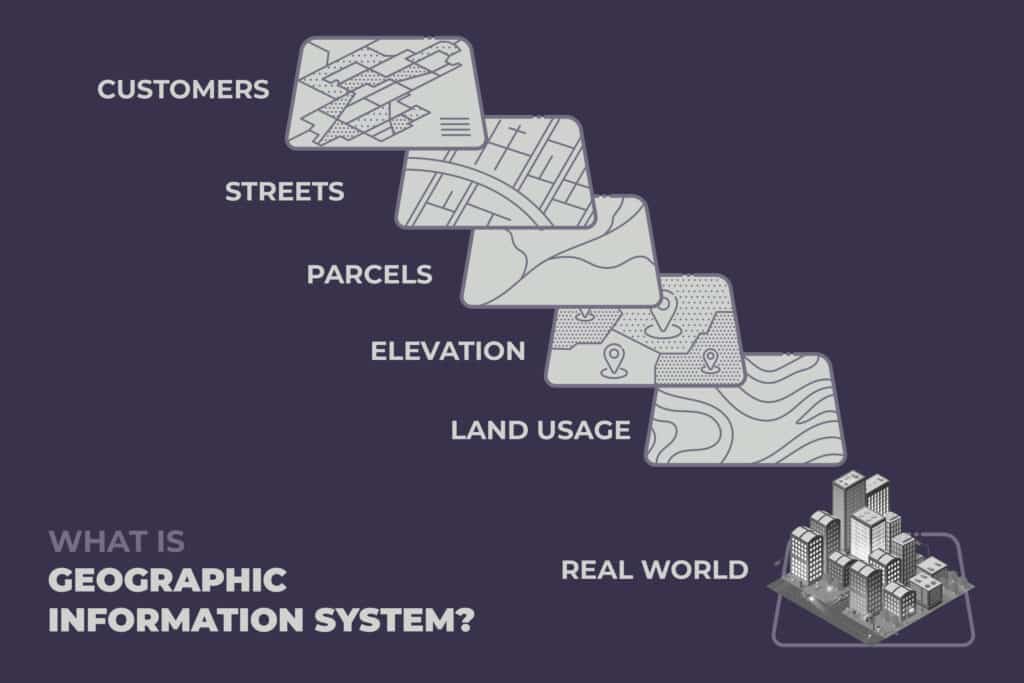
A simple definition of Geographical Information Systems (GIS) is computerized mapping or digital geography. Based on my experience, I prefer to define GIS as managing data in structured layers.
GIS can be considered a spatial database which is similar to any simple database with the difference that it contains attributes for all the necessary factors to visualize all components of a map.

As the above illustration shows, humans are able to perceive a certain place or location with all its components, but don’t have the ability to separate those components and sort information from different layers in order to make a business decision. That’s where GIS comes in to give us a view of different information groups in separate layers where a layer is a table in the spatial database that references the location. Whether we need to locate a certain customer segment, find commercial locations, or determine land usage, the GIS database will offer a specific report of the needed information.
That said, I must mention the formal definition of GIS:
GIS is a system that aims to capture, store, manage, analyze, manipulate, and present geographical data to help decision-makers of any business with the proper information.
All of these definitions and uses of GIS can be summed up in GeoMarketing as it is the implementation of GIS in the decision-making process through specific techniques and strategies. As such, GIS, and by extension, GeoMarketing is extremely important and beneficial in any and all types of business from retail and banking to healthcare and telecom.
The Correlation Between GIS/GeoMarketing & Market Research
Any market research for any purpose begins with the challenge of locating the right market, customers, and competition as well as managing data collectors on the ground. Any market research must start with defining the market research objectives and the protocols to be followed during the data collection and analysis activities. Then, we move to the step of collecting and editing spatial data to analyze it and report results to the decision-makers. All of this must happen not only during the market research but also before the start of the research process.
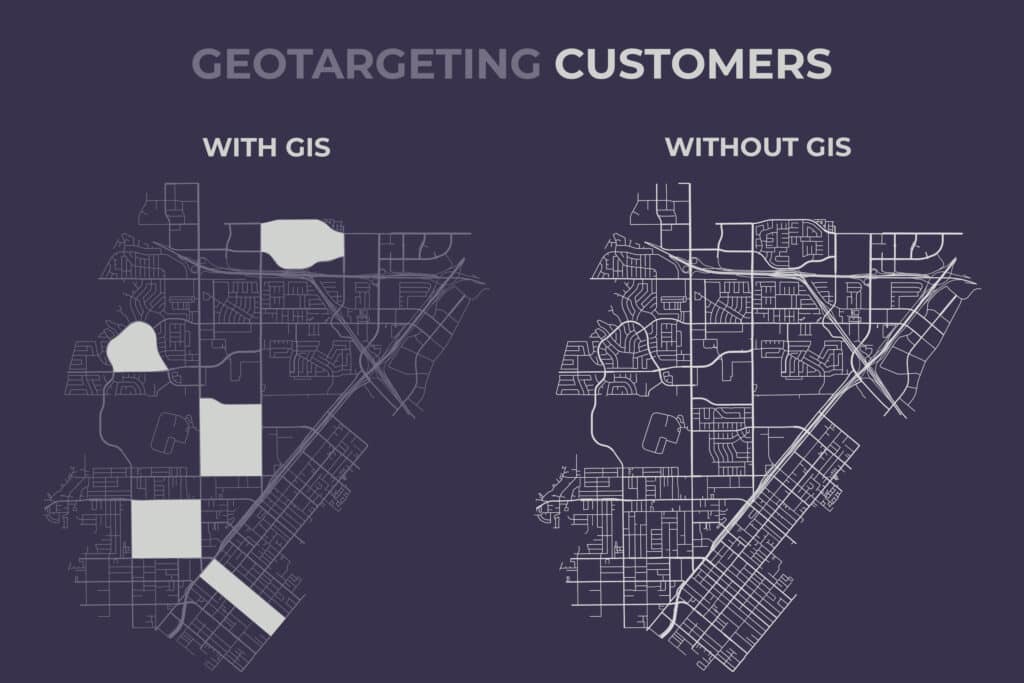
As an activity, market research is mostly concerned with sampling a certain location and GIS is the most powerful tool to select the right sample areas and get unbiased results.
As you can see, the main correlation between GIS and market research is the location as the research activities always begin and end with it.
During one of my experiences with a market research team, the team was defining its sample areas based on the closest locations to their offices and/or homes which turned out to be a huge mistake that affected the integrity of the collected data. Using GIS to visualize the locations’ data, we were able to specify nearly 15 new locations spread out across the whole city. These locations helped the research team to refine their data and, therefore, radically changed the sampling process and the decision-making process as well.
Using GIS, market research agencies can ensure that their sampling is comprehensive and representative of the covered regions as well as getting a well-spread and well-diversified sample. This way GIS and GeoMarketing assist market research teams to overcome their most prominent challenges and improve the decision-making process by maximizing the presented findings and insights.
As a client of a market research agency, GIS enables you to track the areas covered in the market research and verify whether they were the same areas mentioned in the agency’s brief of the market research or not to ensure the validity of the data itself. Another aspect of GIS revolutionizing your market research activity is enabling you as the client to integrate the data collected from different sources, such as two different agencies, to show a bigger picture with more details.
GIS/GeoMarketing & Random Sampling in Market Research
To use GIS/GeoMarketing in sampling, we start by defining the administrative boundaries of the region or country that we’re trying to visualize for analysis. Then we start to divide this region into its smallest geographical units possible to ensure that our research team is able to cover these units with the targeted activities.
For example, in one of my projects, the team needed to collect data from an entire rural community far away from the capital city. The area that we needed to cover was too big to manage. Thankfully, GIS tools enabled us to identify the built-up and occupied areas of this rural town which minimized our targeted location significantly before mobilizing any of the research team to that location.
This specific case was a huge hit as urban areas are easier to divide into districts and sub-districts for sampling whereas rural areas are more difficult to identify and divide for accurate data collection. GIS also made our market research activities easier to manage in urban areas as it assisted in keeping track of the covered sub-districts. This way, we were able to integrate older and newer samplings based on geographic data. For example, an area covered in the first sampling was ignored in the second sampling. This is how GIS improved the accuracy of the collected data and lowered the cost and time of the market research sampling.

Whether your market research team is collecting data door-to-door, at the store exit, or through mystery shopping, dividing and clustering areas using GIS will optimize the process and lower the planning time through the automation of location selection as well as elevate the quality control of the data.
GIS/GeoMarketing & the Market Research Team
Of course, using GIS in market research is not exclusive to upper management or whoever is responsible for planning the research. Sampling using GIS can be shared with the entire team through every individual device used in the sampling such as a tablet.
- First, the targeted area is shared with the surveyors by simply sending a map file similar to sharing a location over an app. With one click, all of your team’s surveyors know where to head to conduct the sampling.
- Next, GIS gives directions as to how to reach the targeted area much like Google Maps. So, no one gets lost on the way and no time is wasted on communications trying to get directions.
- GIS enables you to track your on-site personnel through the GPS in the devices, which leads to even better quality control and validation of the collected data.
- Finally, with some GIS tools, a feature called Geo-Fencing is activated to lock the questionnaire so that the surveyor is not allowed to open it unless he or she is in the target location!
By sharing the capabilities of GIS and GeoMarketing tools with the entire team you’re guaranteeing to get the job done in less time and taking control over the data collection process without needing to micromanage team members.
GIS/GeoMarketing & Data Validation
The general rule says that you can’t control what you can’t monitor and, with an endeavor such as large market research where many people are involved in the data collection, it may seem that it cannot be controlled. However,GIS / GeoMarketing gives you the right means to monitor every step of the market research whether you’re a client or an agency.
As you can see in managing the research team using GIS tools, GeoMarketing plays a pivotal role in data validation throughout all the market research stages.
- By sharing the selected sampling area through a smartphone or a handheld device, the research team lead can track the surveyor’s activity in real-time as he/she enters the specified borders or the area.
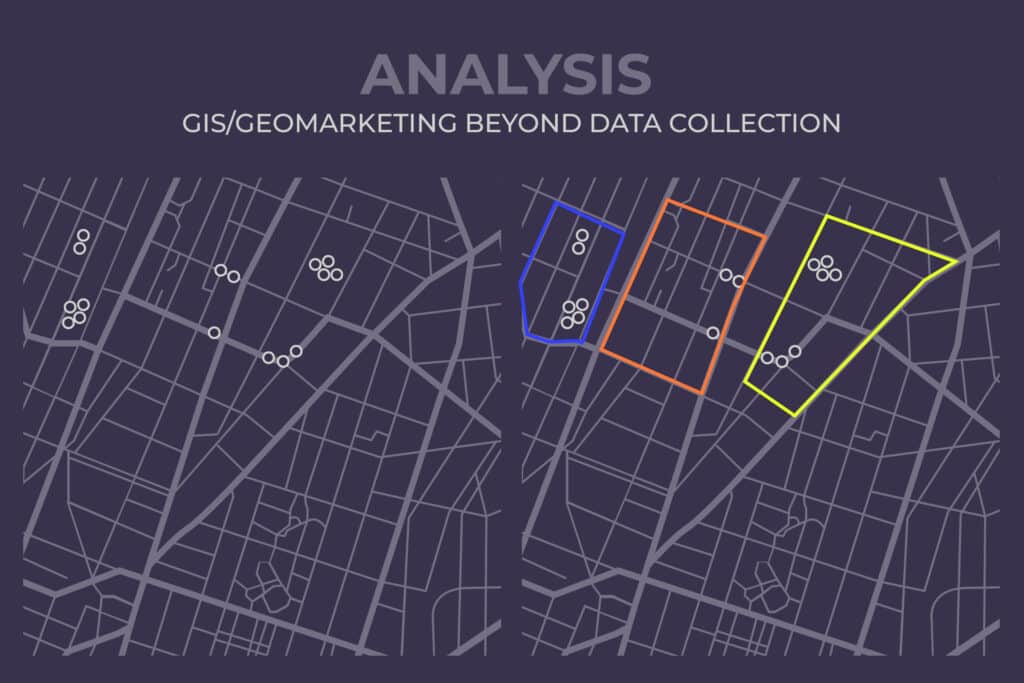
- You can also see the points where the surveys were taken on the map and determine whether the data collection was well-spread and within the sampling area, or did the surveyor go out of the area or collected all the data from one locationpoint on the map and didn’t bother to spread out the data collection geographical points, for example.
- GIS / GeoMarketing makes this possible not only on a map view but also through detailed and comprehensive reports showing whether each surveyor had their GPS enabled or not, which gives an indicator of the surveyors’ behaviors during data collection. The GPS being on or off alone can give you an initial hint to the accuracy of the collected data.
- GIS / GeoMarketing reports also show the coordinates (longitude & latitude) of every single survey to see how close or far apart they were taken.
In real-life examples, we were able to detect cases using GIS / GeoMarketing where the surveyors sat in a coffee shop in a mall filling their surveys when they should have been moving in a much larger sampling area collecting data door-to-door. Another case was when one surveyor’s map showed that most of the surveys were clustered in a small area ignoring the rest of the wide sampling area while one survey was conducted completely out of the sampling area on the highway, probably on the surveyor’s way back to the office!
In these cases, GIS / GeoMarketing showed us the attitude of the surveyors towards their data collection duty which, in turn, said a lot about the poor quality of the collected data.
Analysis: GIS/GeoMarketing Beyond Data Collection

There’s a statistic n assumption that 80% of an organization’s data is linked to a certain location. GIS / GeoMarketing enables you to visualize this data on a map and to see the location it’s linked to whether aggregated as one large sampling area, or each individual surveyor’s data.
Geographical visualization of data on a map, for example, helped us see the aggregated data of users of different telecom companies in different districts. This allowed our client to know which areas to focus on in campaigns based on their market share in our GeoMarketing research report.
Market research reports provided by GeoMarketing are not just focused on campaign purposes. In another case, the map showed us that customers of a certain business in area (A) were visiting a store located in area (B), 1.5 KM away from area (A), while there was another store of the same business located in area (A). When the company investigated the area (A) store, they found out that the customer experience in this store was very poor and this is why customers avoided it and chose to go to the further one. As a result, the business was able to make the decision to improve the customer experience in area (A) store.
The third case was kind of funny as the client was considering closing one of their stores because it was losing the business money. GIS / GeoMarketing research showed that this store was in a prominent area with a huge volume of customers. So, when the company investigated the losing store, they found out that customers were avoiding it simply because the air conditioner was broken and it wasn’t a pleasant experience for customers to go to this particular store!
Lastly and most importantly, GIS / GeoMarketing can help you visualize stores and locations of merchandising materials and compare them to the sales volume in each location so that management is able to make optimized decisions in terms of the distribution of these merchandising materials.
As you can see, the applications and uses of GIS / GeoMarketing and its unlimited capabilities must be defined by your business objectives for the research activities. Otherwise, you’d have this superhero of a tool not knowing where to go or what to do with it.
Conclusion
Geograpic Information Systems – GIS techniques, GeoMarketing concepts techniques, and location-based technologies are becoming more and more essential in any market research activity from the planning stage of the data collection, to controlling the data quality and being able to validate it, and, finally, being able to visualize the collected data over its corresponding areas to make an informed decision.
Applying GeoMarketing tools in your market research will help improve your team performance as well as the quality of your data if you’re a market research agency. On the other hand, if you’re a client of a market research agency, GeoMarketing will help you validate the collected data and the activities performed by the market research team.


